Agent Visualizer
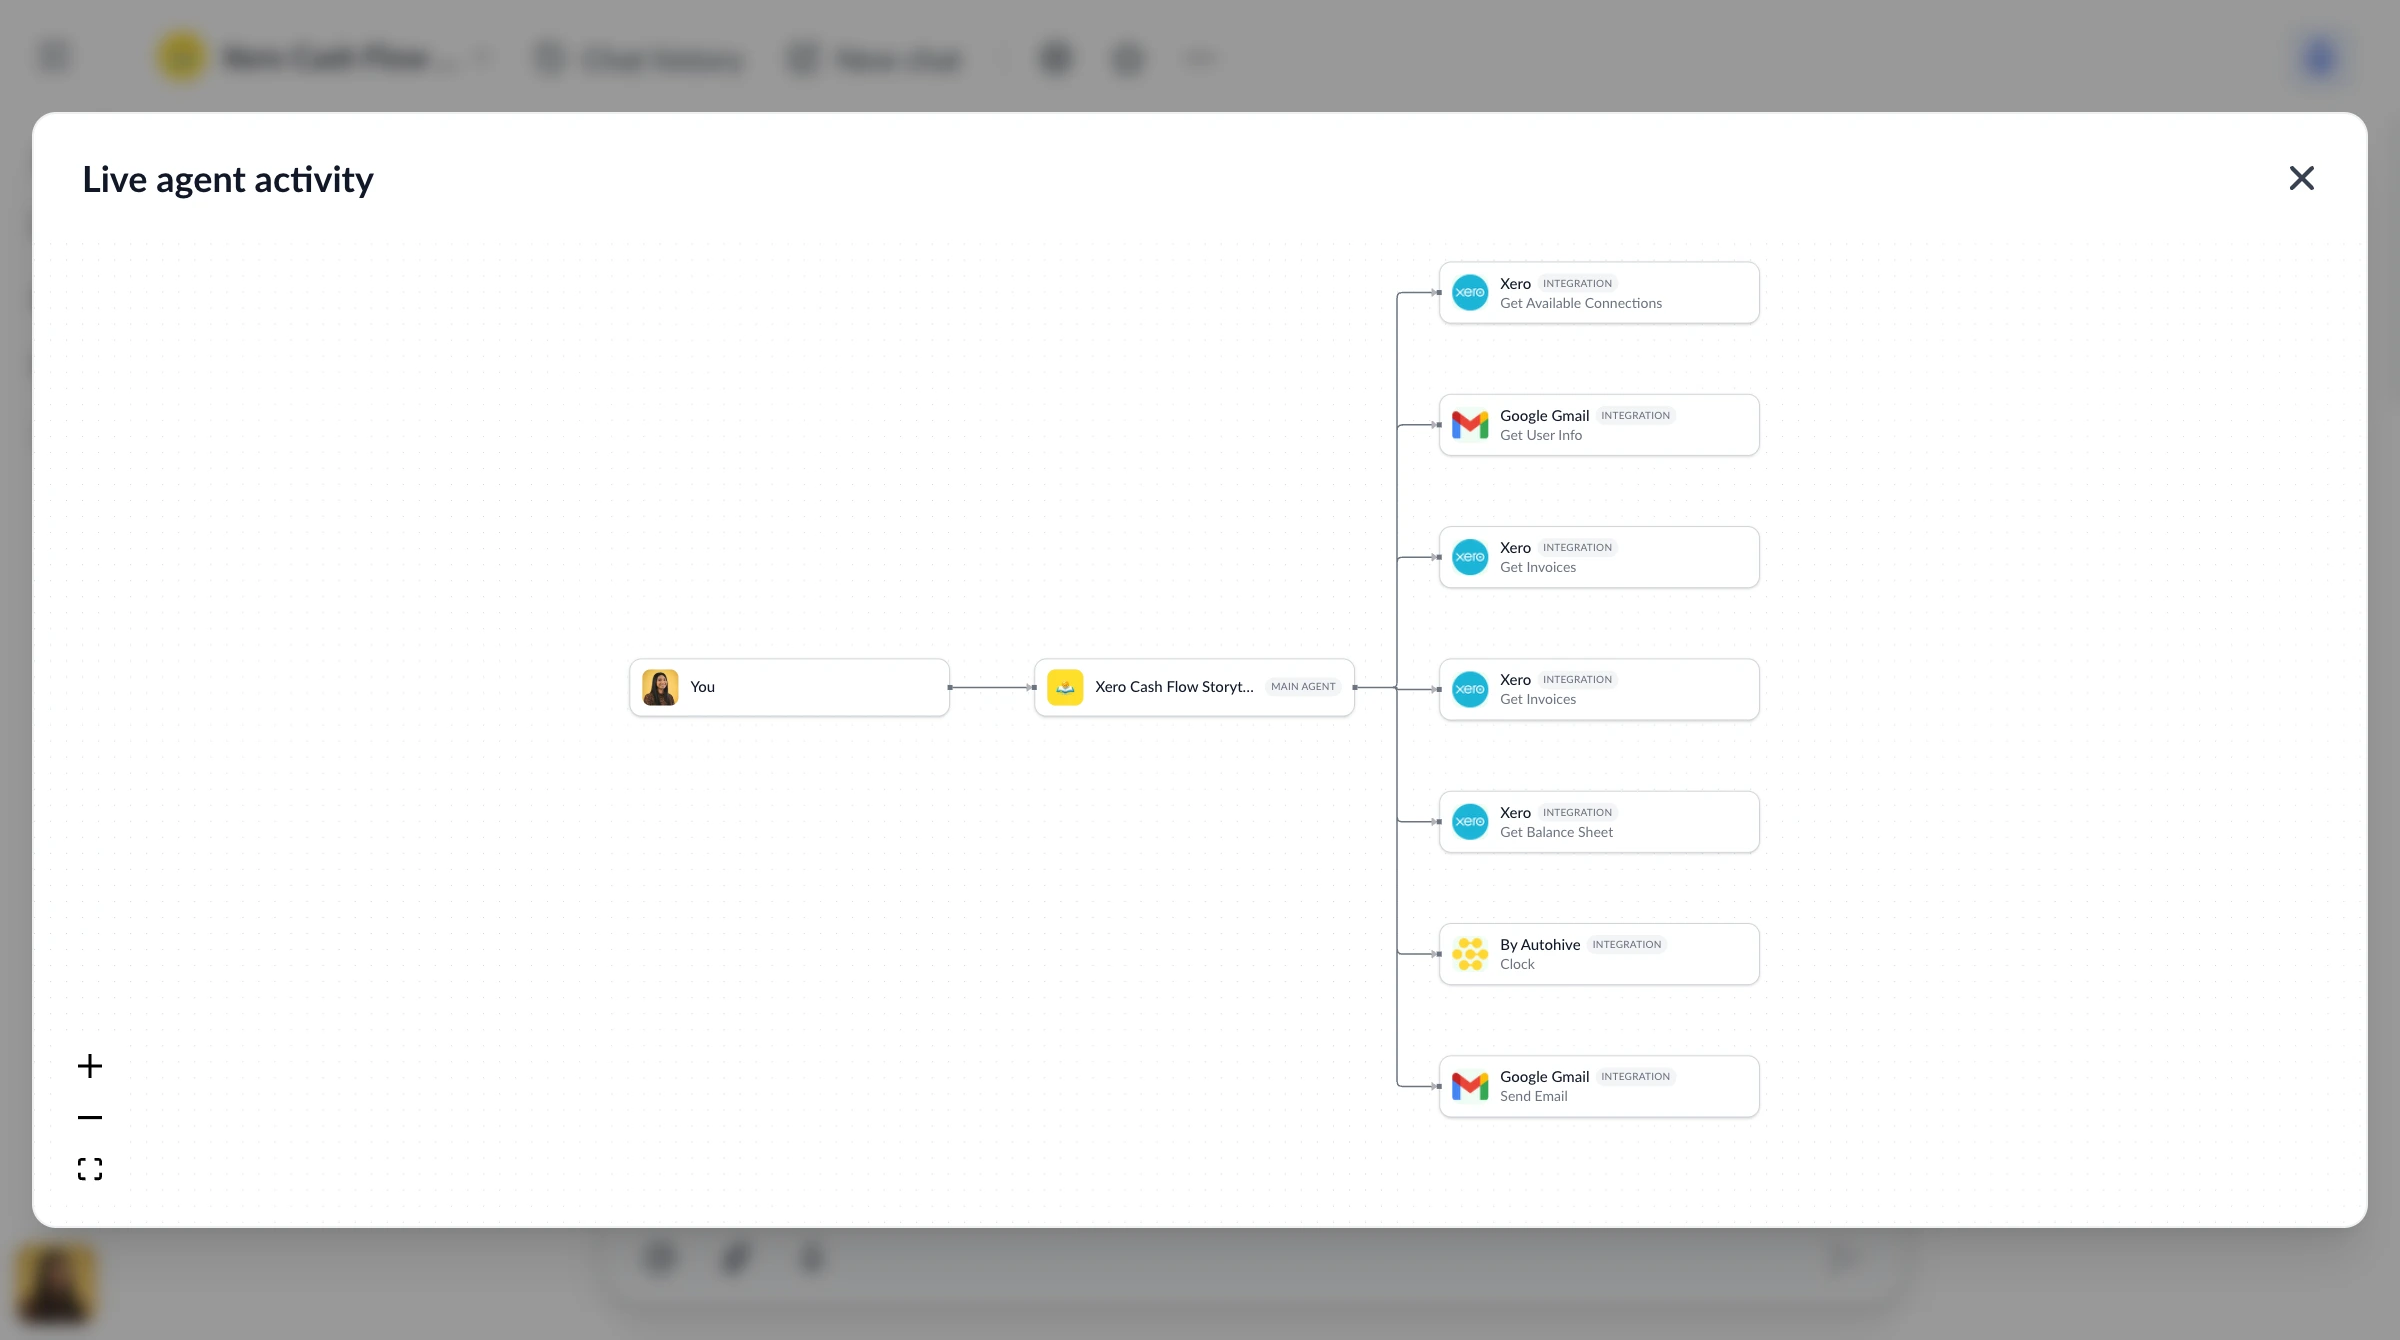
The Agent Visualizer shows you a live flowchart of what’s happening while an agent works on your request. It updates in real time, showing which agent is responding, whether it’s calling in sub-agents or other agents, and which integrations it’s using.
It’s especially useful for understanding why a response is taking a while. It also helps you follow a complex request that fans out across several agents and tools.
Opening the visualizer
A Visualize button appears in the conversation header’s icon stack once an agent turn has activity to show. This includes an agent calling a tool, delegating to another agent, or simply responding. Click it to open a full-screen view of the current turn’s graph, or press Alt + Shift + V on Windows, or Option + Shift + V on Mac.
The button is not shown, and the shortcut does nothing, until there is something to visualize.
Reading the graph
The graph lays out every participant in the current turn as a node. Edges between nodes show how the request flowed:
| Node type | Badge | Meaning |
|---|---|---|
| Main agent | Main Agent | The agent you’re chatting with directly |
| Sub-agent | Sub-agent | An agent called in by another agent to help with part of the task |
| Integration | Integration | A call to an app or built-in tool (e.g. Gmail, Slack, web search) |
Integration nodes also show the specific action that was called (for example, Send Email), not just the integration’s name. This helps when an agent calls the same integration more than once in a turn.
Status
- The node currently being worked on is highlighted with a ring and an elapsed-time counter.
- Completed integration calls turn green with a “Success” label.
- Failed integration calls or failed agent delegations are shown as a red box labelled “Failed”.
- Integration or sub-agent calls that were declined (for example, an action requiring approval that was denied) are shown as an amber box.
- Agents remain neutral once finished (they don’t carry a success/failure state the way integration calls do).
Zooming and panning
Use your trackpad/mouse to pan and zoom, or the on-screen zoom controls. The view fits the whole graph automatically when it opens. You can zoom out further to bring a very wide fan-out of calls fully into view.
What the visualizer shows — and what it doesn’t
The visualizer is a map of activity, not content:
- It shows agent names, integration/action names, and call status and timing.
- It does not show message content, tool inputs/outputs, or any conversation text.
Persistence
The graph for the most recent turn is saved. It’s still there if you reload the page or come back to the conversation later. Opening a different conversation, or sending a new message, replaces it with that conversation’s own graph.
Availability
The Agent Visualizer is available to all plans. It requires no setup. The Visualize button simply appears in any conversation once there’s activity for it to show.
Troubleshooting
| Issue | Possible cause | How to fix |
|---|---|---|
| Visualize button doesn’t appear | The current turn has no tool calls, delegations, or activity yet | Wait for the agent to start responding, or ask a question that requires a tool/sub-agent |
| Graph looks incomplete after reconnecting | A dropped connection can briefly delay activity syncing | Give it a moment to catch up, or reopen the visualizer |
| Graph doesn’t match the latest message | You’re viewing a saved snapshot from an earlier turn | Send a new message to generate a fresh graph for the current turn |